Estimate Generation
Estimate generation is a component that can generate estimates to a model. The power of Valuatum system is within the automatic estimate generation and the ability to change the estimates. It is essential to generate the estimates before generating a report, and the automatic estimates provide a good starting point for more accurate estimates. Estimate generation uses the historical financial figures and creates forecasts for the following years based on a set of predetermined rules. The most important estimates are Net sales growth and EBIT-%.
The estimate generation rules can be modified in the superadmin page in the platform. The user therefore can overwrite the standard rules. Simple rules can use if-conditions, for example to handle negative historical values for Net sales growth.
Contents
Net sales growth in estimate generation
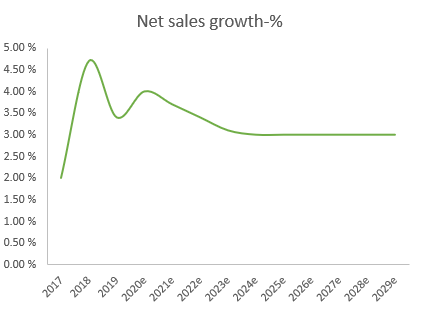
Net sales growth-% is arguably the most important estimate, as well as a good example of a rather simple but appropriate estimate rule. It is estimated by calculating the average growth from previous years. Net sales growth-% gradually converges to 3%, which would be a sensible upper bound for growth, during the estimate years.
Case 1
For a company which has had reasonably positive net sales growth, the first estimate years will also have positive growth, while the estimate will start to converge to a more conservative long-term growth rate.
Case 2
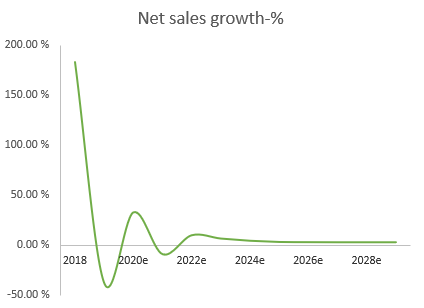
This company has had unbelievable high growth. However, it has also had negative growth. Calculating the average will make sure that any estimates will not be completely unreasonable. The negative growth years will smoothen the estimates down even more. It is also not expectable that the company will grow with the same rate anytime in the future. Thus, it is reasonable that the net sales growth estimation automatically converges.
Case 3
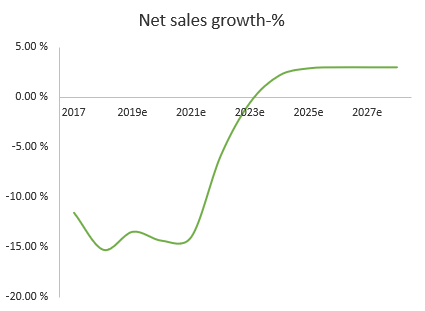
This company has had difficulties in growing the business. However, following the general practice in valuation, the estimated growth rate will converge to a reasonable long-term level.
EBIT and ROI in estimate generation
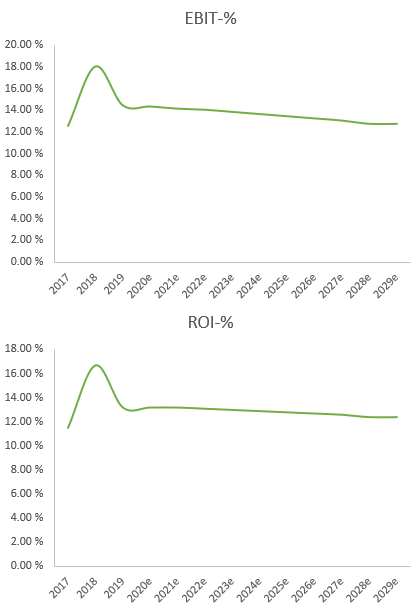
EBIT-% is estimated from the average historical values, while simultaneously targeting a reasonable ROI-% with which the business would be sensible to continue operating. EBIT-% converges to the level during the estimate period.
Case 1
The company has also had good profitability. The historical average plays part in the first few estimate years, while the percentage will gradually converge to the level in which ROI-% is on a reasonable level.
Case 2
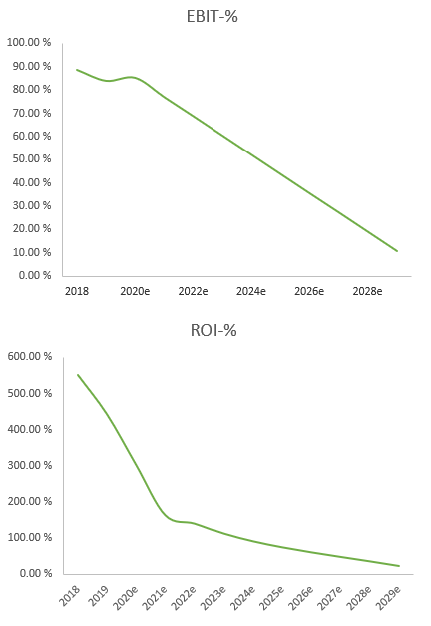
The company in Case 2 also has had incredible profitability. However, the situation would not make any economic sense in the long-term, therefore the profitability estimates decline to the reasonable level.
Case 3
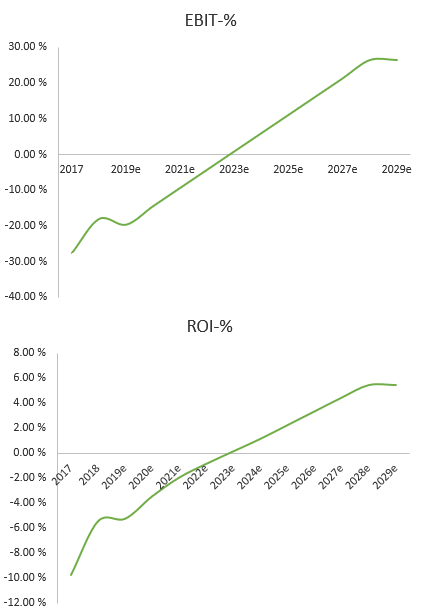
In this case, the company has made losses. The automatic estimation of EBIT-% starts to converge to a ROI-% level in which the business is reasonable to continue to operate.
Other items
Depreciation, financial items and balance sheet items are mainly estimated by calculating the ratio to some other item. For example, it is reasonable to assume that working capital items go in line with net sales, as those are related to the scale of the business. For payout ratio, the latest historical figure is used. Same applies to depreciation. The depreciation percentage is calculated from the latest year, which is then applied for estimate year assets.
