Automatic Reports
Valuatum offers credit risk reports that users can generate with a click of a button. The report templates are fully customizable, meaning that any content such as text, images, tables and graphs can be inserted into the template. Our reports can be downloaded either as PDF files or Word documents. In addition to credit risk reports, we also provide valuation reports.
Customizability
Our credit risk reports can be tailored to your specific needs, meaning that whatever information you want on your reports can be inserted into our reports. This includes, but is not limited to, tables that are populated with financial data or graphs that are drawn using the company’s financial data.
Financials and tables
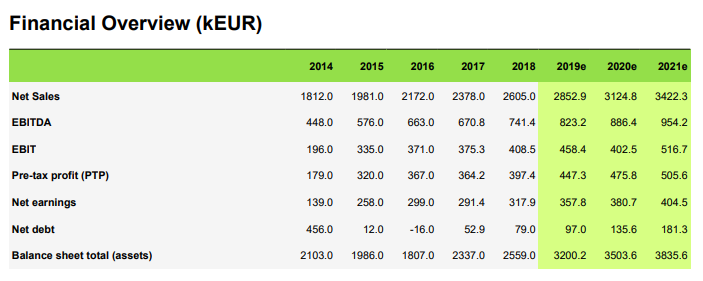
Tables that contain financial information are very common in our reports. For example, many of our credit risk reports have tables on the company’s income statement and balance sheet, just like our Company Views pages. Similarly, credit risk report includes the estimated bankruptcy risk and credit rating derived from that.
Additionally, our reports include tables that can be customized to your needs. For example, a credit risk report could contain an overview table where all the most important figures and financial data is shown, or you could have a cash flow analysis table for valuation purposes.

Graphs
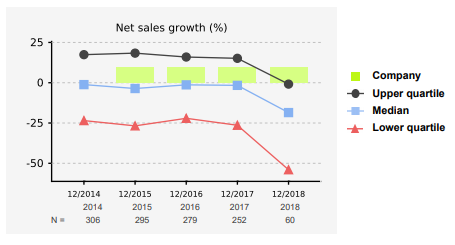
All the data in our system can also be shown on the credit risk report in graphical form. This includes both historical data, automatically generated estimates and manually inputted estimates. Data can be shown in any typical kind of graph such as bar graphs, line graphs, multi-axis graphs or pie charts.

