Company Views
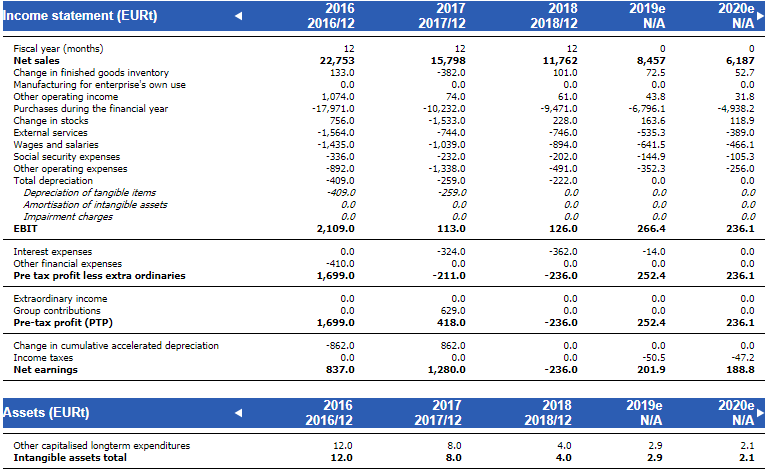
Company Views pages provide an easy access to financial statements and key figures of the companies.
- We can include any ready-made or tailored graphs and figures built using the financial statement data
- Currently our database consists of financial statements of nearly 200 000 Finnish companies (source: Bisnode Finland)
- We can also import external (customer’s own or third party) data into our system
Key Features of Company Views pages
Overview of the financial position of a company
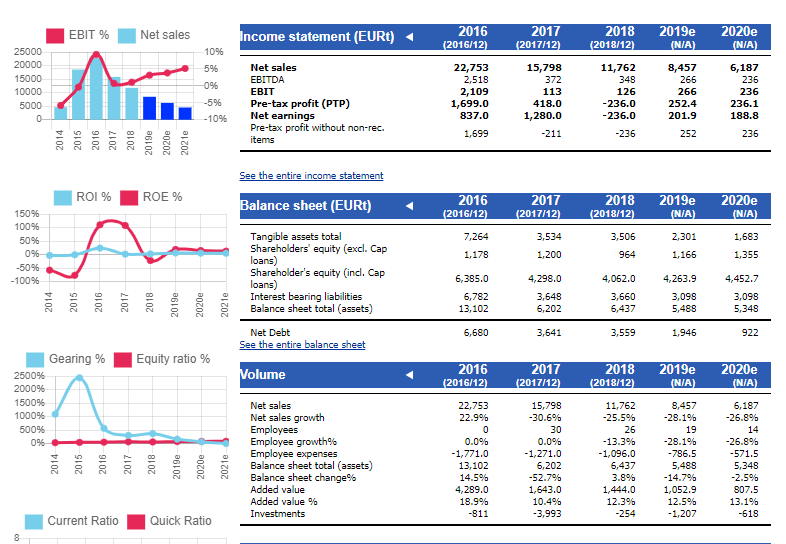
- Provides a comprehensive outlook into the financial position of a company
- The user can view both the historical figures and the estimates generated by the system or updated by an analyst
- Layout and content of the pages can be modified – You get to choose the figures and graphs you want to use
- We have hundred of key figures and variables – and new ones can be created in a few minutes when requested
- The company data can be shown on your own website with a JavaScript widget.
Financial statements
Customized pages
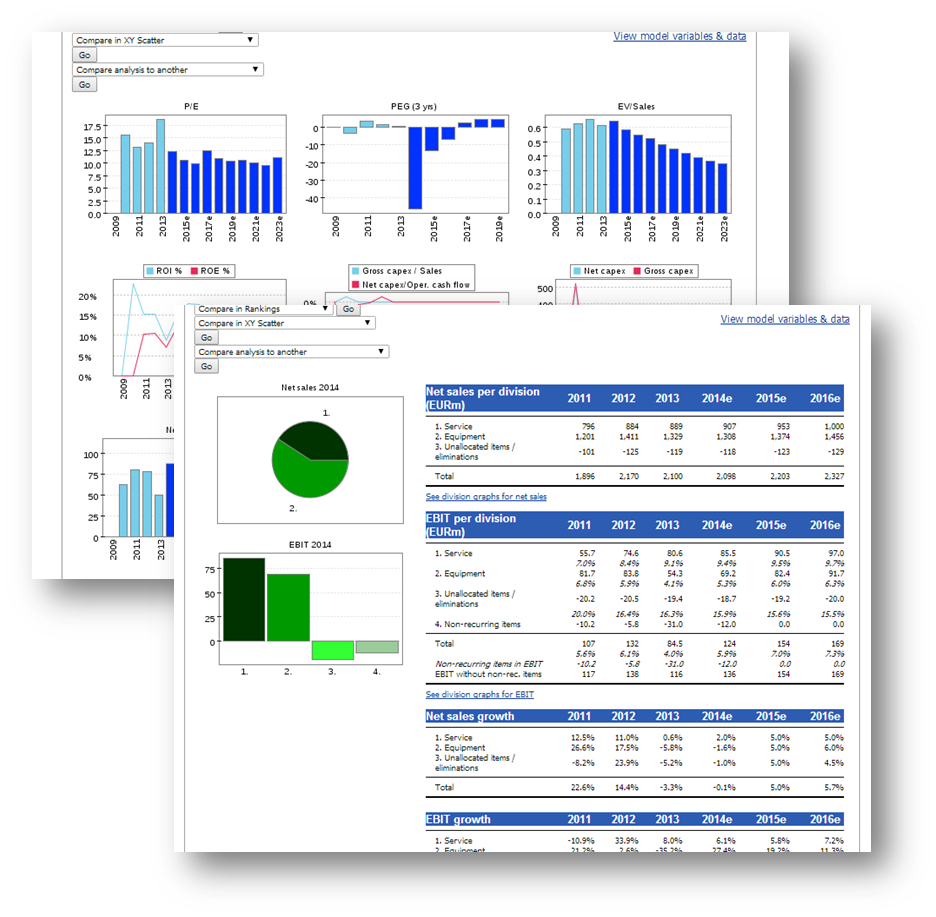
- We can easily build customized pages that consist of practically any graphs and tables derived from financial statement data that exists in our database
- The system comes with hundreds of imported and calculated financial figures and ratios, and if something you need is missing, we can quickly create it
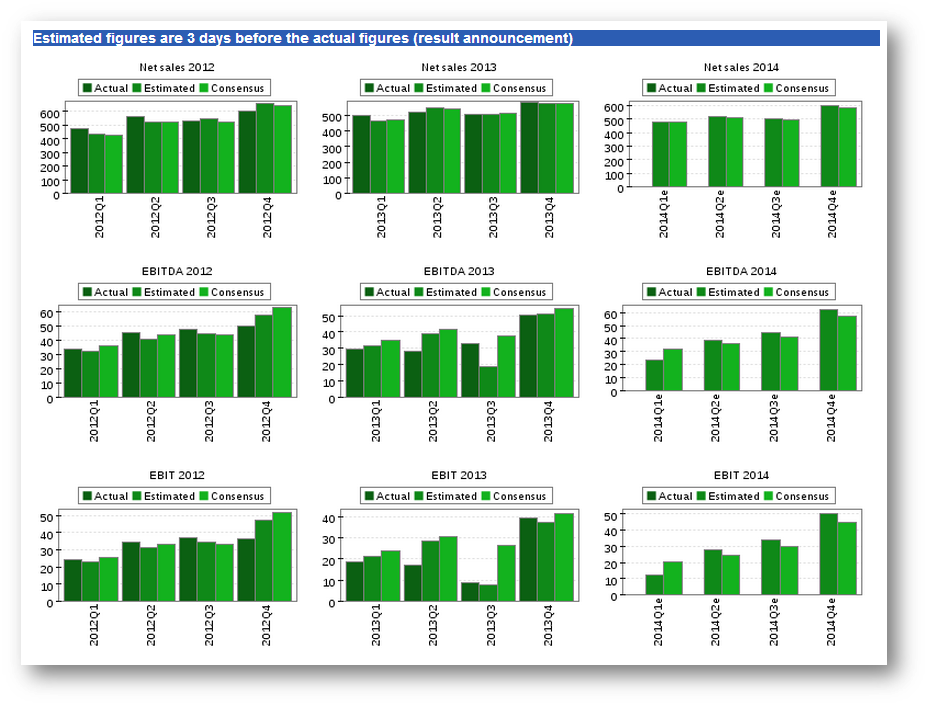
- As an example (see the screenshot below), we have implemented a page where actual values, consensus estimates and estimates made by analysts are presented. This page illustrates on the one hand the performance of the analyst in question against consensus estimates, and on the other how well consensus have been able to forecast the financial development of the company.
Changing figures
- The system generates future estimates automatically for the income statement and balance sheet based on the given rules
- All future estimates as well as the historical figures can be changed by the user with Change Estimates feature
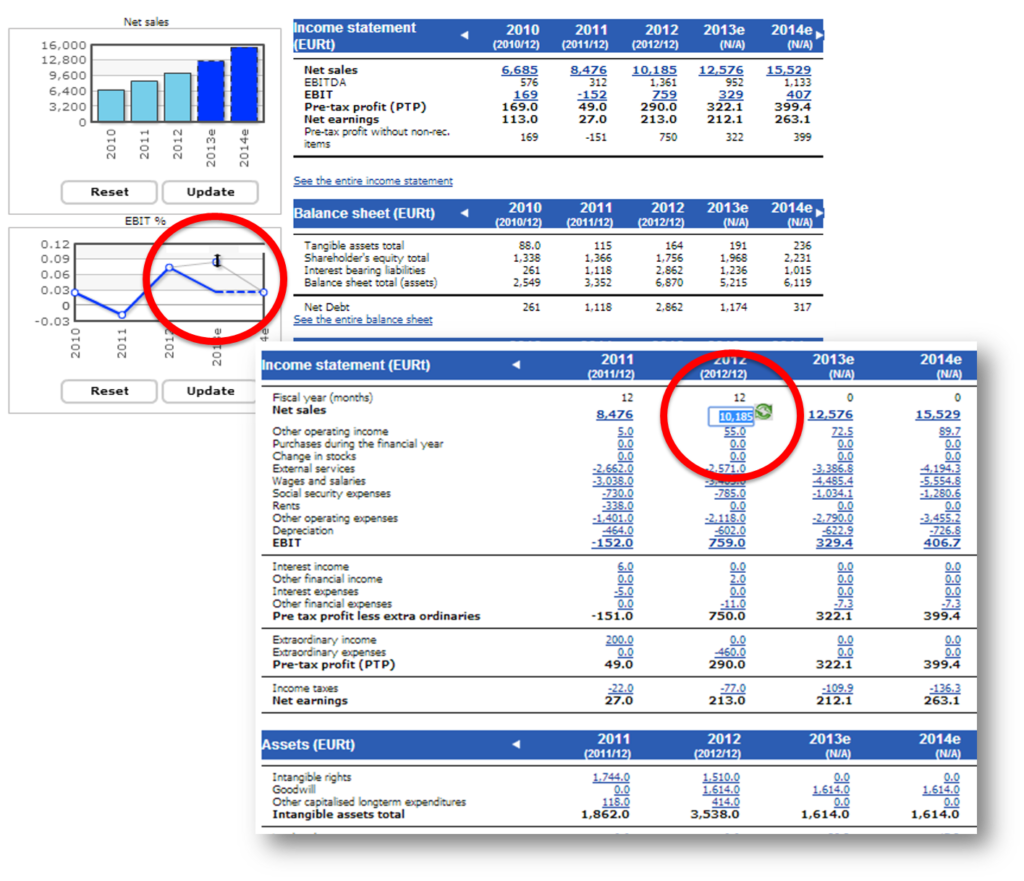
- Estimates can be changed directly from the web pages by changing the figures on the tables or even by dragging some bar/line in the graphs up or down. All the key figures are updated automatically to correspond new estimates (or adjustment to historical figures) within one second after the user does this kind of change on the www-pages. See an example from our guided video tour (This part begins at about 3:20)
- The numbers can also be changed with both excel and java models and then uploaded with one click to the database and webpages. All three models (Website, Java model and Excel model) can be used at the same time in creating different kinds of scenarios. All models present the same figures since they utilize the common database.
- After changing figures, the user can save her own model and for example use Comparison Tools to compare the model to other companies

