The Valuatum platform utilizes state-of-the art machine learning models for estimating bankruptcy risk. However, such models are relatively new, and many firms still use non-optimal models for estimating bankruptcy risk. In this summary, we will walk you through the categories of different methods that have been, and are being utilized to calculate bankruptcy risk.
Simple two-ratio models
Two-ratio models are a rudimentary method for evaluating bankruptcy risk, that has still been widely utilized up until recent years. This kind of models are easily understandable and relatively accurate, and have thus been quite popular. Two-ratio models are also quick to develop with basic statistical knowledge, which has helped their popularity.
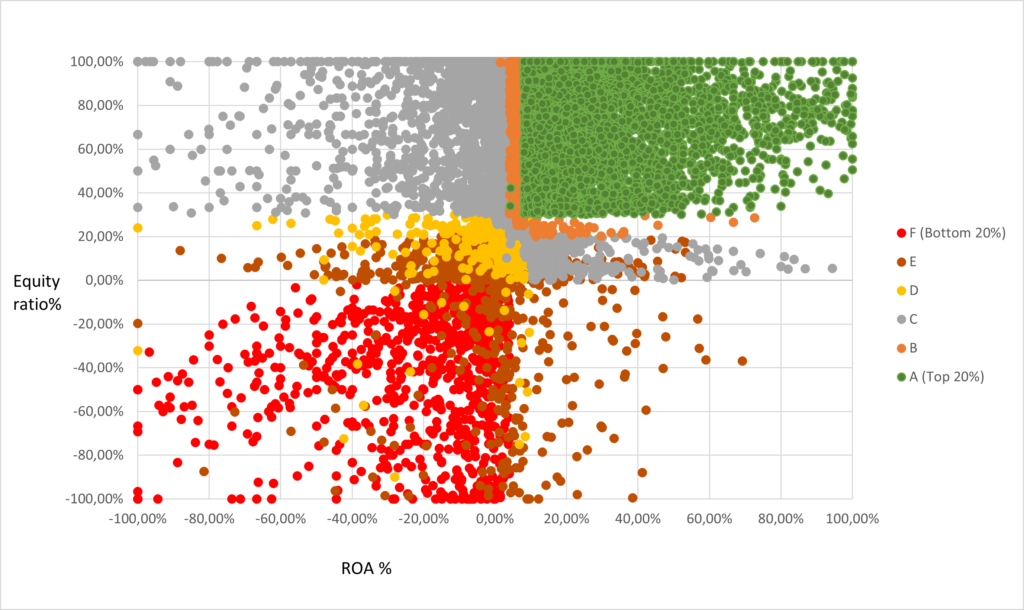
Two-ratio models predict bankruptcy risk by rating companies based on some key financial ratios, based on predetermined thresholds. For example, the two ratios could be chosen to be Equity Ratio (ER), describing solidity, and Return on Assets (ROA), which describes the profitability of a company.
To illustrate the idea, we could choose the thresholds for our key ratios as per the table below

So if we have, for example, a company that had an ER of 0.27 and ROA of 0.09, the company would receive a credit rating of B. If a company fell into two different categories, we would then calculate the average of the two given ratings, e.g. if a company had ER of 0.32 and ROA 0.07, we would get two ratings A and C, the average of which would give the company a rating B. If we cannot calculate the average rating, for example if we need to take the average of A and B, we would then consider one variable to take the precedence.
Naturally, this kind of model leads into strict categories for credit ratings, as can be observed on the plot below. While useful, the problem is that this sort of models oversimplify many things, and fail to detect outliers. For example, if we had a third variable, that would be very relevant for estimating bankruptcy risk, the model would fail to capture that and assign too high (or low) rating for companies.
Logistic regression models
Presently, perhaps the most commonly used models in bankruptcy risk calculation are logistic regression models, that are widely employed both in companies, as well as in academia. The model is often preferred to the simple two-ratio method, as it allows for more accurate estimates.
The method allows for a large, theoretically unlimited selection of predictive variables for predicting defaults. The general idea of logistic regression models is similiar to that of linear regressions, that are a relatively simple model for predicting outcomes based on predictive variables. However, while linear regression predicts continous quantities (e.g. the turnover of a company), a logistic regression predicts categories, such as credit ratings.
A logistic regression is given as a polynomial function, that assigns weights to different parameters in predicting an outcome. The weights themselves are calculated using a fitting method, such as ordinary least squares. The fitting process makes the calculated model as representative of the data as possible. A logistic regression equation could for example be the following:
Rating = 0.005 - 0.001 * ROA - 0.022 * Equity Ratio ...With this model, companies would in general have a 0.5% risk of bankruptcy, and a 0.1% better rating for each % in ROA, as well as 0.22% better rating for each % Equity Ratio.
While logistic regression models can give quite accurate estimates, the issue with this sort of models is their inability to distinguish nuanced, company specific characteristics that might influence bankruptcy risk. This is due to the fact, that the model is trained based on averages derived from data, that might not appropriately reflect the characteristics of individual companies.
For example, a logistic regression model would place equal importance on liquidity for both well off and poorly performing companies. Naturally, liquidy is not as an important for well off companies as poorly performing ones, due to their ability to raise capital, and a logistic regression model would miss that nuance.
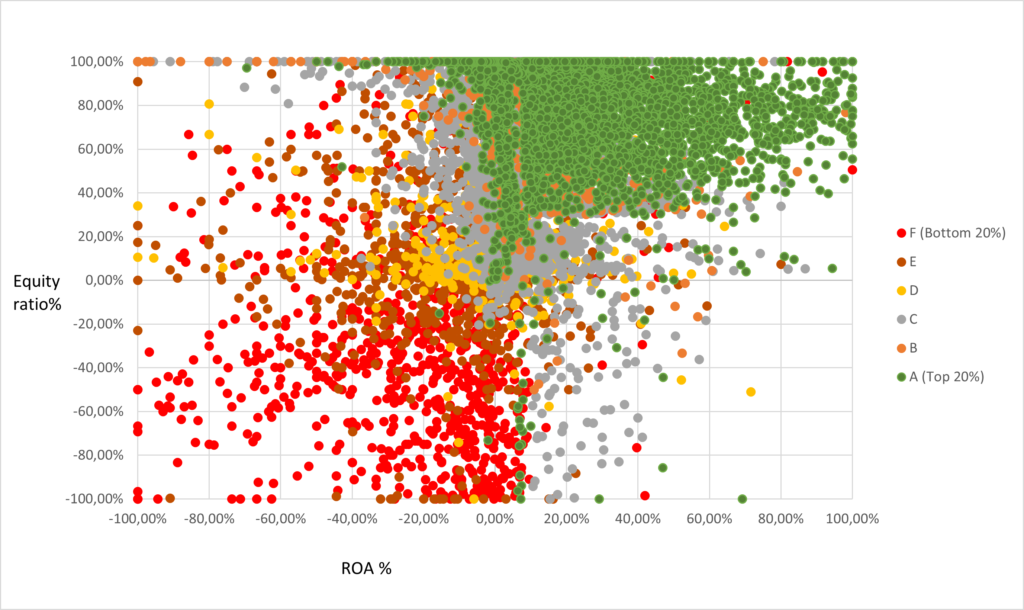
Hence, the model is quite rigid and often fails to deal with outliers, although it is an improvement over simple two-factor models. This can be observed on the plot below, where we have more fluency in the credit rating categories as compared to the two-factor model.
Gradient boosting models
At Valuatum, we utilize a machine learning method, called gradient boosting to estimate bankruptcy risk. An implementation of the method, called XGBoost, is a significant improvement over the earlier, and more commonly used bankruptcy risk calculation methods. Gradient boosting is a relatively new, but highly accurate technique with proven usage, especially in the business domain. The method itself is a result of rigorious cumulative academic research that modern machine learning is based on.
Gradient boosted models, such as the one used by Valuatum, are very nuanced, and able to capture even the slightest individual characteristics in companies. This is largely enabled by the fact, that these models are constructed with hundreds of thousands of individual data points from different companies.
In general, gradient boosted models, such as the state-of-art XGBoost implementation, construct so-called decision trees, that are constructed of individual decision nodes. At each of these nodes, a company is classified into one of two child nodes, based on the decision criteria of that node. For example, a node could classify companies based on their ROA, such that companies with ROA less than or equal to 50% would be classified one way, and the rest the other way.

The final decision tree that is constructed from the data is then based on tens of thousands of individual nodes like this. What naturally follows, is that the model captures nuances individual, and rare situations very effectively, as well as the usual cases. The model is hence based on empirical evidence with such fine-grained nuance, that constructing the model itself by hand would be an impossible feat for humans to do, without the help of machine learning.
A gradient boosting model could, for example, capture a situation in which some items of a company’s assets were growing relatively too fast, compared to their volumes, indicating potential lack of solvency. The model would then be able to connect this signal missed by human eye, to increased credit risk. In the plot below, we see an example of credit ratings with a gradient boosting model. Again, we see increased fluency as compared to the previous model, as well as more accurate detection of outliers.

Summary
In this article, we covered three key methods for calculating bankruptcy risk for companies. While simple two-ratio models and logistic regression models can capture credit risk quite accurately, best results and largest benefit are achieved with state-of-the art gradient boosting methods, that are proven in practice. While the gradient boosting models are harder to implement, we have developed a ready-to-use solutions for our clients at Valuatum.
| Model | Simple Two-ratio | Logistic Regression | Gradient Boosting |
| Accuracy | Acceptable | Good | Best |
| Adaptability | Fixed | Rigid | Fluid |
| Technique | Classifying companies by two heuristically chosen key figures | Predicting credit ratings with a set of variables in a regression analysis | Predicting credit ratings with a nuanced decision tree handling various situations |